Key figures
Profit after tax
4,344 NOK million
Hydropower production
13.8 TWh
Greenhouse gas emissions
459,554 tCO₂e
Sorting rate
89 %
Number of employees
686
Number of injuries
2.9 per million hours worked
| NOK million | 2022 | 2021 |
|---|---|---|
| FINANCIAL KEY FIGURES | ||
| Revenues and other income | 22,028 | 10,847 |
| EBITDA | 20,087 | 8,979 |
| Operating profit (EBIT) | 19,340 | 8,463 |
| Underlying operating profit | 19,914 | 9,678 |
| Profit before tax | 18,879 | 7,901 |
| Profit after tax | 4,344 | 2,611 |
| Net interest-bearing debt | 9,523 | 11,336 |
| -of which subordinated debt | 7,338 | 5,264 |
| Total assets | 97,265 | 63,584 |
| Capital employed | 65,609 | 43,046 |
| Investments in operating assets | 870 | 590 |
| ROE (%) | 12.5 % | 9.9 % |
| ROCE (%) | 35.6 % | 19.2 % |
| Net interest-bearing debt/EBITDA (x) | 0.5 | 1.7 |
| FFO/Net interest-bearing debt (%) | 141 % | 54 % |
| Equity ratio (%) | 44 % | 42 % |
| Other key figures | 2022 | 2021 |
|---|---|---|
| Number of employees | 686 | 438 |
| Turnover (voluntary termination) | 3.6% | 2.5% |
| Number of injuries per million hours worked (H2) last 12 months | 2.9 | 6.9 |
| Greenhouse gas emissions (Scope 1, 2 and 3) (tCO2e) *) | 459,554 | 3,573 |
| Hydropower produced (TWh) | 13.8 | 18.3 |
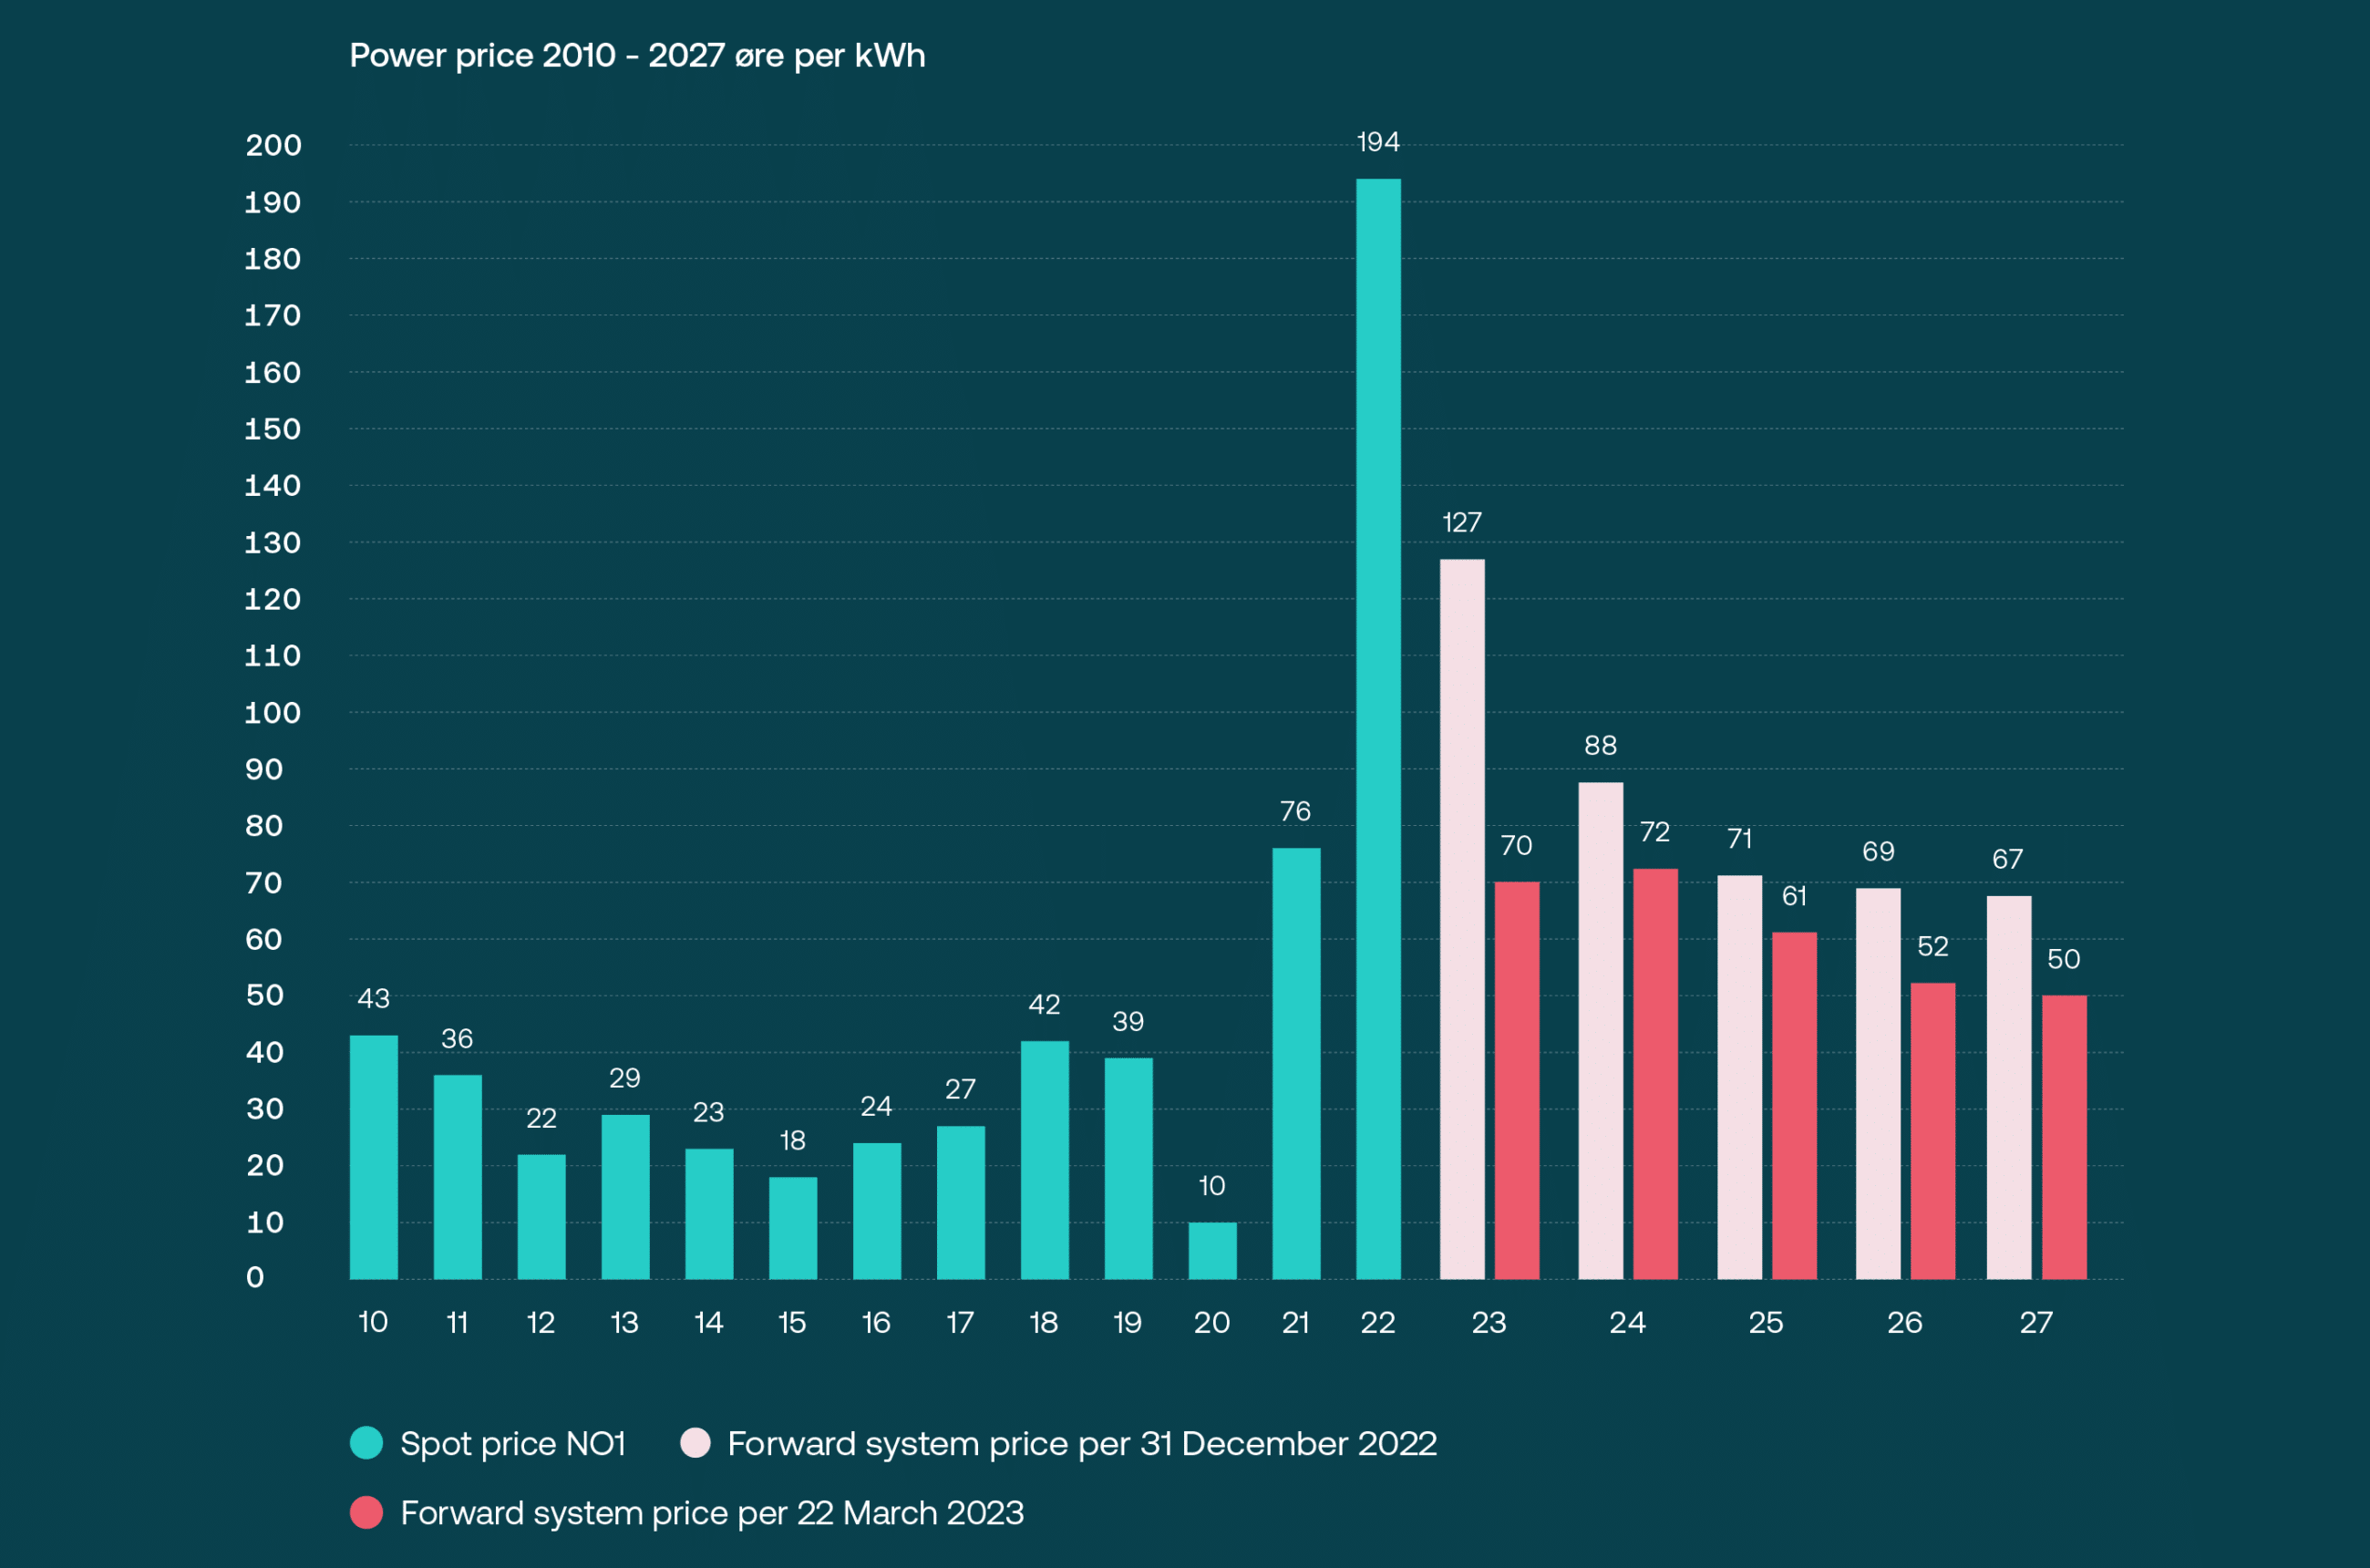
| Achieved power price (øre/kWh) | 150 | 62 |
| Nordic system price (øre/kWh) | 137 | 63 |
| Heat sales (GWh) | 761 | N/A |
*) The climate emissions include market-based emissions in scope 2. The 2022 figures include an expansion of scope 3 emissions and climate emissions from Hafslund Oslo Celsio, while the 2021 figures exclude Hafslund Oslo Celsio and only include very limited scope 3 emissions.